Understanding Events and Trends
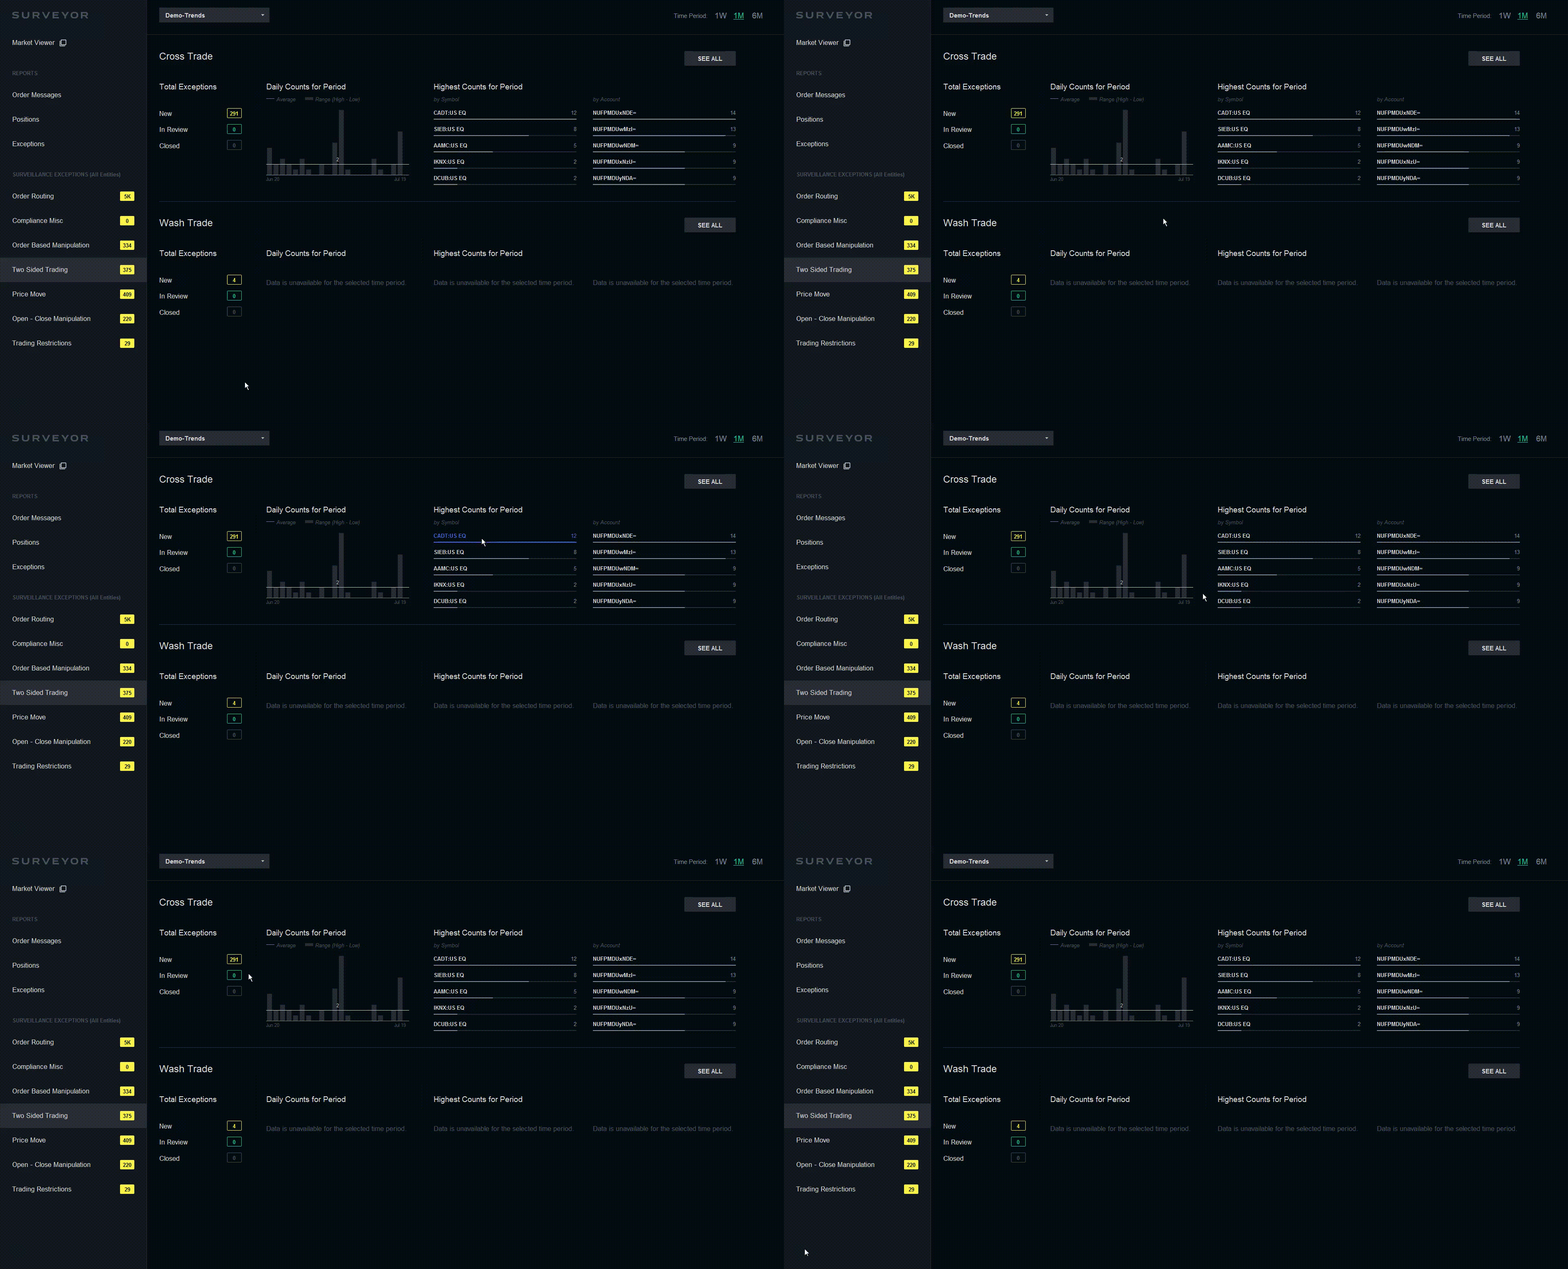
Surveyor collects surveillance exceptions, categorized into different themes, for your review. Clicking on a theme brings up the relevant surveillance exceptions on the right side of the screen. From here, you can look at the summary of events and trends for each exception.

Trends are divided into four sections:
Time Period: Select the time period at the top right, to view data from a specific time period: 1 week, 1 month, or 6 months.
See Changes: Under total exceptions, you are able to see what is new, marked in review, or marked closed.
Daily Events Graph: The daily number of events for the period selected are displayed in the graph, with a built-in average number on a line that can be used as a relative indicator.
Most Active Stock Symbols and Accounts: The stock symbols, as well as the accounts, that occur the most in your selection are displayed next to the graph.
Reviewing Exception Events in Surveyor
If you need to review a specific type of event, here’s a quick overview of how to do each type in Surveyor:
How to review a layering event
How to review a spoofing event
How to review an insider trading event
How to review an trade concentration event
How to review an opening/closing auction manipulation