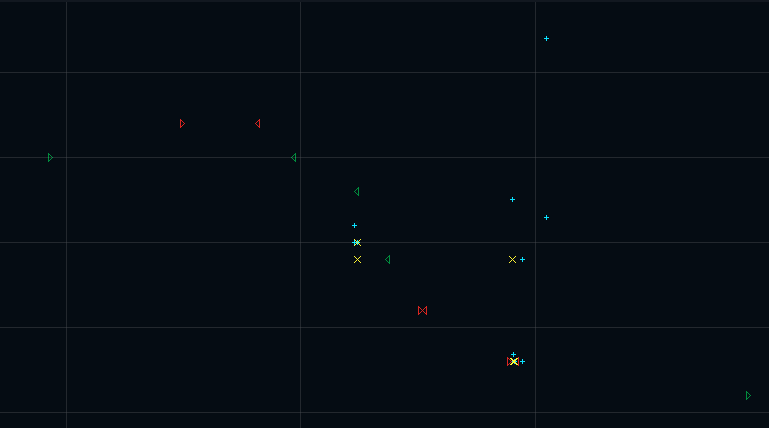
Surveyor uses icons to designate certain actions happening in a graph. There are four primary types you’ll see frequently, listed below. To learn more about how these icons appear on graphs, visit the article about chart layers.

ICON LIST

Right pointing arrows indicate orders entered by the user’s firm (green for buy, red for sell).

Left pointing arrows indicate orders cancelled by the user’s firm (green for buy, red for sell).

Yellow X’s indicate executions by the user’s firm.

Blue crosses indicate executions by any firm.