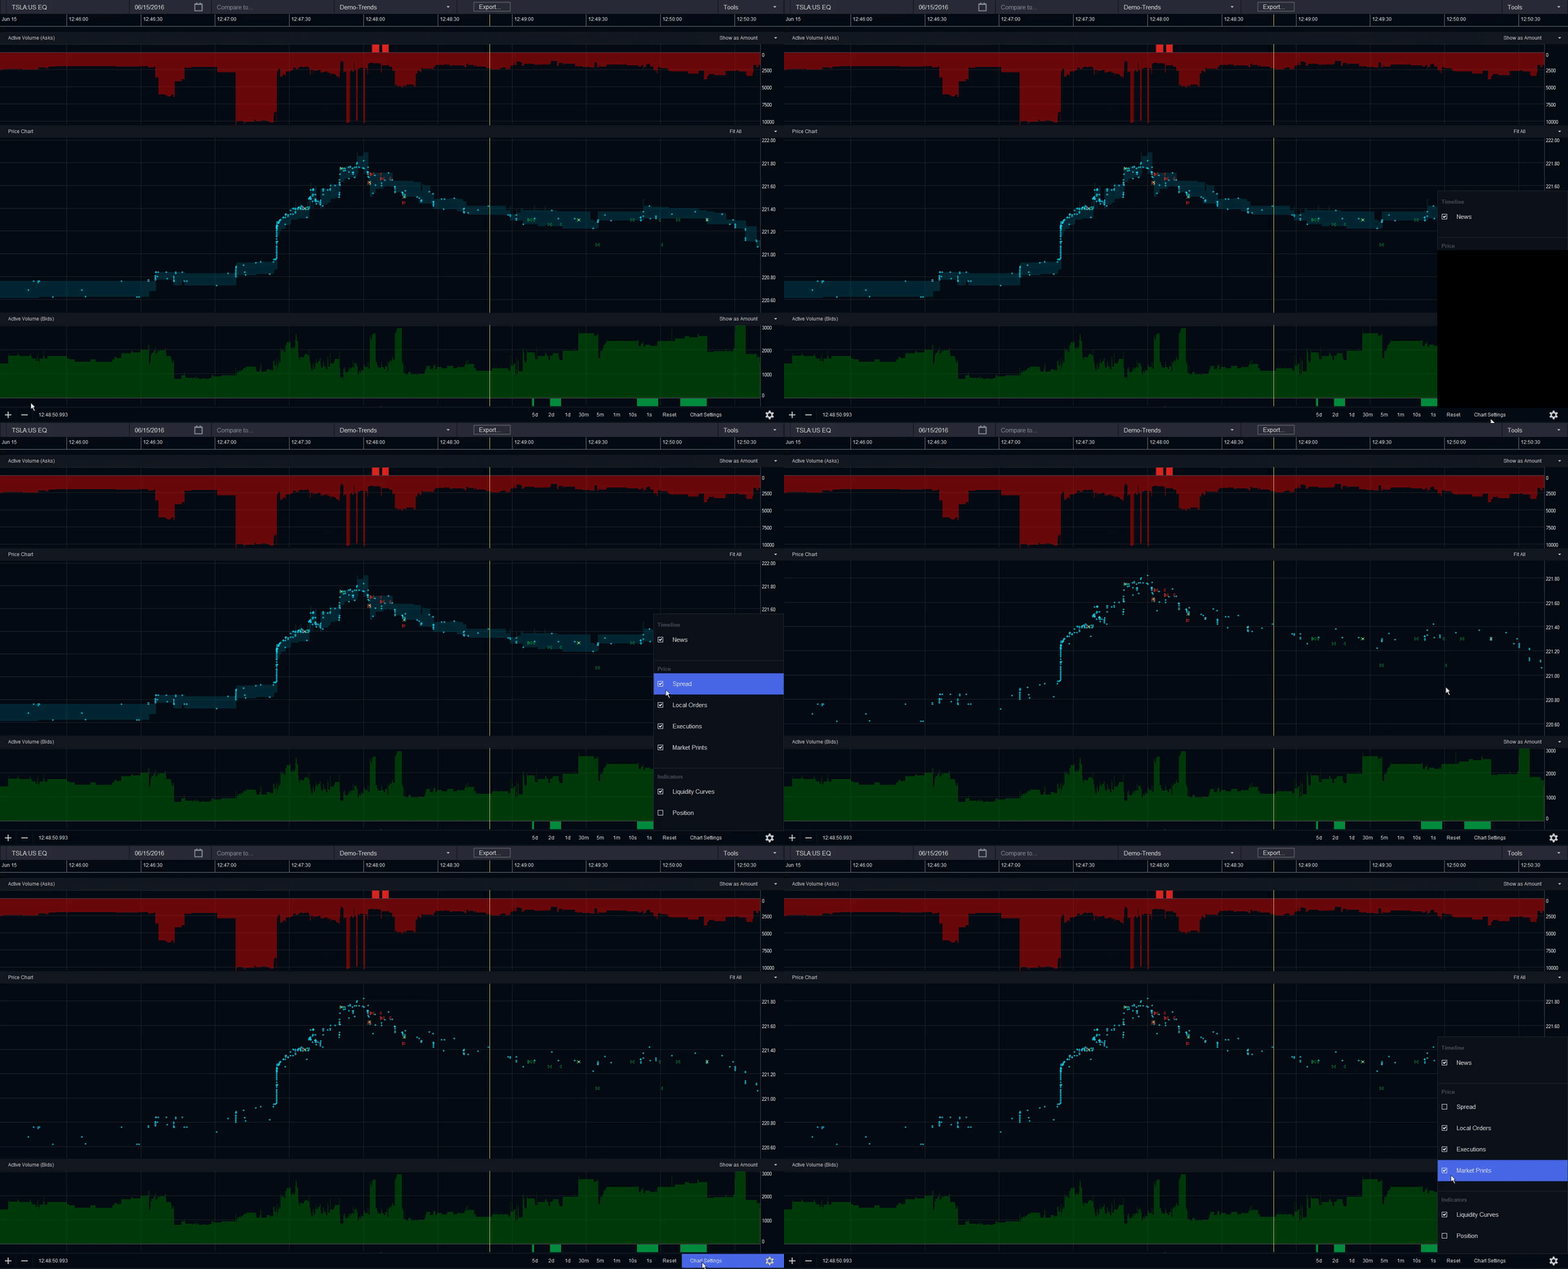
Chart layers and Indicators can be used to filter out certain types of information on the stock you are viewing.

Accessing the Chart Settings Menu
To access the chart layers and indicators menu, click on Chart Settings in the lower right hand corner of the main viewing window.
Showing or Hiding Indicators
You can use this menu to show or hide the Indicators window, which appears below the main viewing window if selected. The Indicators window can be used to show liquidity curves, spread and position.
Spread: the bid-ask spread.
Liquidity curve: the volume of shares quoted that is visible to the public in the top 10 tiers on either side of the order book (dark green for buy side, and dark red for sell side).
Position curve: the firm as a whole or an individual account’s position.
Filtering Information Types or Layers
From the chart settings menu, you can click on any of the checkboxes to hide or show the selected information type, including news, local orders, executions, and market prints.
In addition to exploring one stock symbol, you can also compare two symbols at once with all of the data mentioned above.